Tracing in Kata Containers
Written by James Hunt, Chelsea Mafrica
Overview
This article will show you how to use Kata Containers tracing to see where time is being spent running your workload.
After describing briefly what Kata Containers is and how to obtain it, we will show how to enable tracing, collect some trace data, and view the trace results.
Audience
This article is aimed at Kata Containers users and system administrators, and Linux users with some experience with container technologies such as docker and Kubernetes.
Terminology
Container
For the sake of simplicity, this article uses the term container to refer to a Kata Containers container: a container environment hosted inside a hardware-isolated virtual machine (VM).
Containers created with Kata Containers use both VM hardware isolation and the traditional container technologies to provide a greater level of security and isolation.
Traditional Container
The term traditional container refers to a Linux container created by container management systems like docker, containerd and Kubernetes. A traditional container is built using the Linux kernel’s cgroups and namespaces software features.
Workload
The workload is the application the user has requested to be run inside the container environment. Examples are a command line shell, and a web server.
Kata Containers
Kata Containers is a novel open source container solution that uses lightweight VMs coupled with standard Linux container technologies to manage the running of a workload process.
The combination of hardware isolated VMs coupled with traditional Linux container technologies creates a strong security stance as the workload is isolated from the host environment in multiple ways.
Kata Containers interoperates with standard container management systems like containerd and Kubernetes. Use of Kata Containers is transparent: once it is installed and the container manager system is configured to use it, the creation of new containers will magically use Kata Containers to host the workload.
Kata Containers runs on Linux systems on modern 64-bit hardware and supports a variety of different hypervisors to suit a wide variety of use cases.
See the Kata Containers installation documentation for the various ways you can install Kata Containers.
Kata Containers is configured using a TOML format configuration file. The provided default configuration is sufficient to run a workload in a VM environment, but there are many options available for controlling various aspects of the system.
Kata Components
Kata Containers comprises two main components:
- The runtime, which is responsible for launching a VM to host the container environment and starting the agent.
- The agent, which runs inside the VM and is responsible for managing the lifecycle of the workload process.
The Kata Containers runtime and agent communicate with each other using a VSOCK socket, which is a special type of Unix socket specifically designed for communication between the host and a VM environment.
Trace Forwarder
There is another component that is only needed if agent tracing is enabled: the trace forwarder. This is a stand-alone program that needs to be run on the host if you wish to enable agent tracing. Its job is to listen to the agent running inside the VM and forward on the trace data it generates to the host system.
For an ASCII diagram showing how the trace forwarder and agent interact, see the Kata Containers architecture document.
What is trace data?
At its simplest level a single trace records the overall duration of some operation. The single trace itself comprises a set of spans, which are arranged in a tree as part of the trace. This is similar to a filesystem whose root directory contains one or more files or directories. A key point is that there is only a single trace, but it expands to a number of spans.
A trace span captures the duration of some operation and comprises the following attributes:
- A start time
- An end time
- A name
- An optional set of name/value pairs that further describe the span. Kata Containers spans typically also include a source (agent or runtime), package and subsystem.
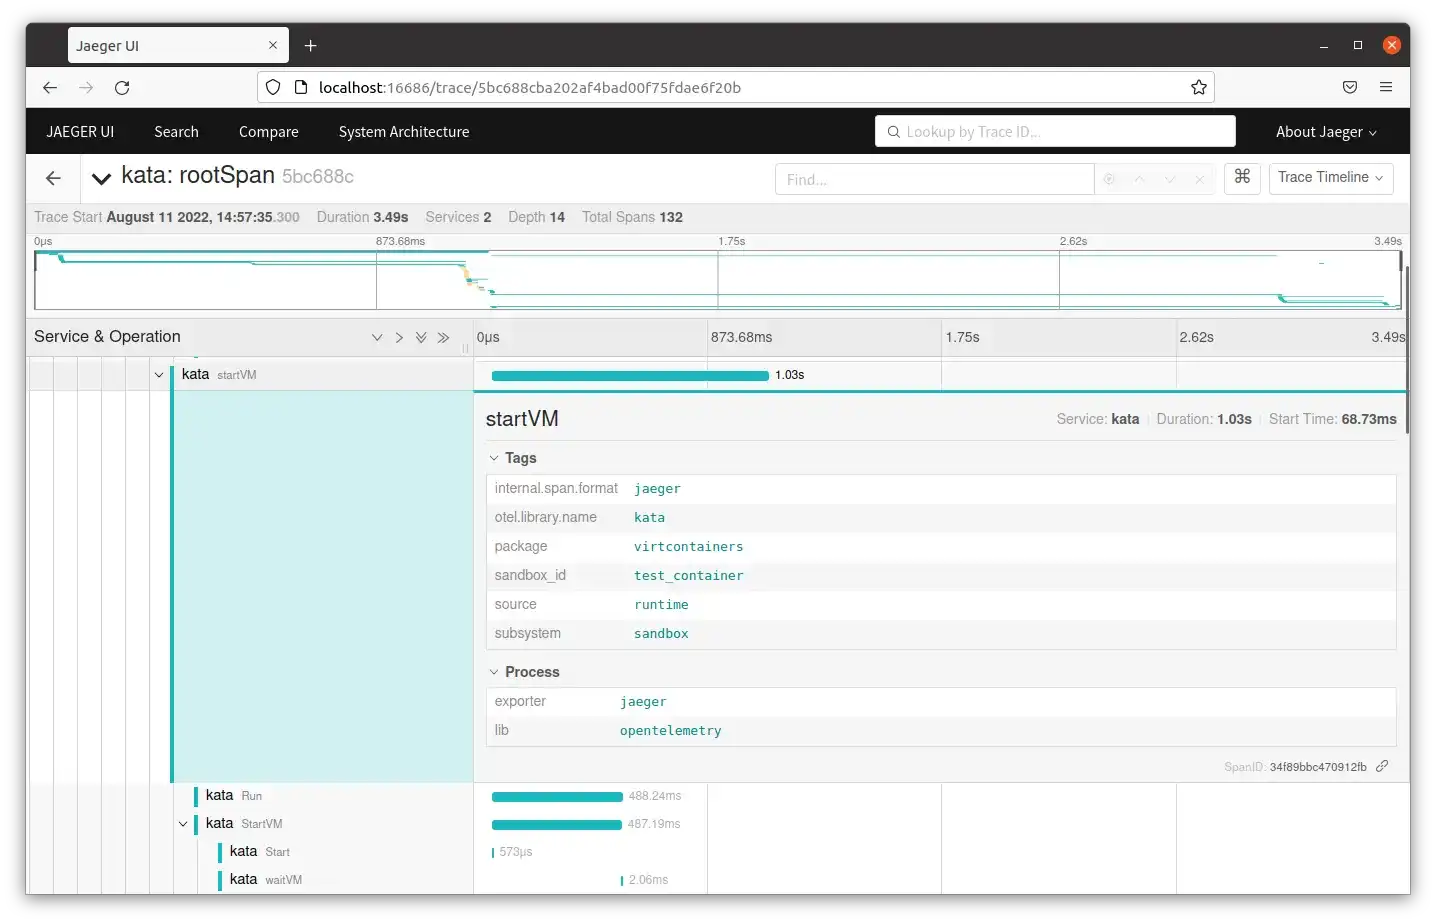
The image above shows trace output in the Jaeger UI with a trace titled startVM expanded to show attributes including the package name, sandbox ID, the source, and subsystem. Also, visible is the duration and start time.
Kata Containers uses the OpenTelemetry standard and creates a single trace (with multiple spans) to encapsulate the entire runtime of particular Kata Containers components.
Key points:
- There is only a single trace, but there are multiple spans within this trace.
- The timestamps that form part of each span can be used to arrange the spans into a tree structure.
- Studying the spans visually allows you to see which operations started and possibly ended before other spans, and identify hot spots (areas of the system that are taking a lot of time to finish).
- The root span contains all other spans. This means that the duration of the root span is the duration of all the spans, or the duration of the runtime.
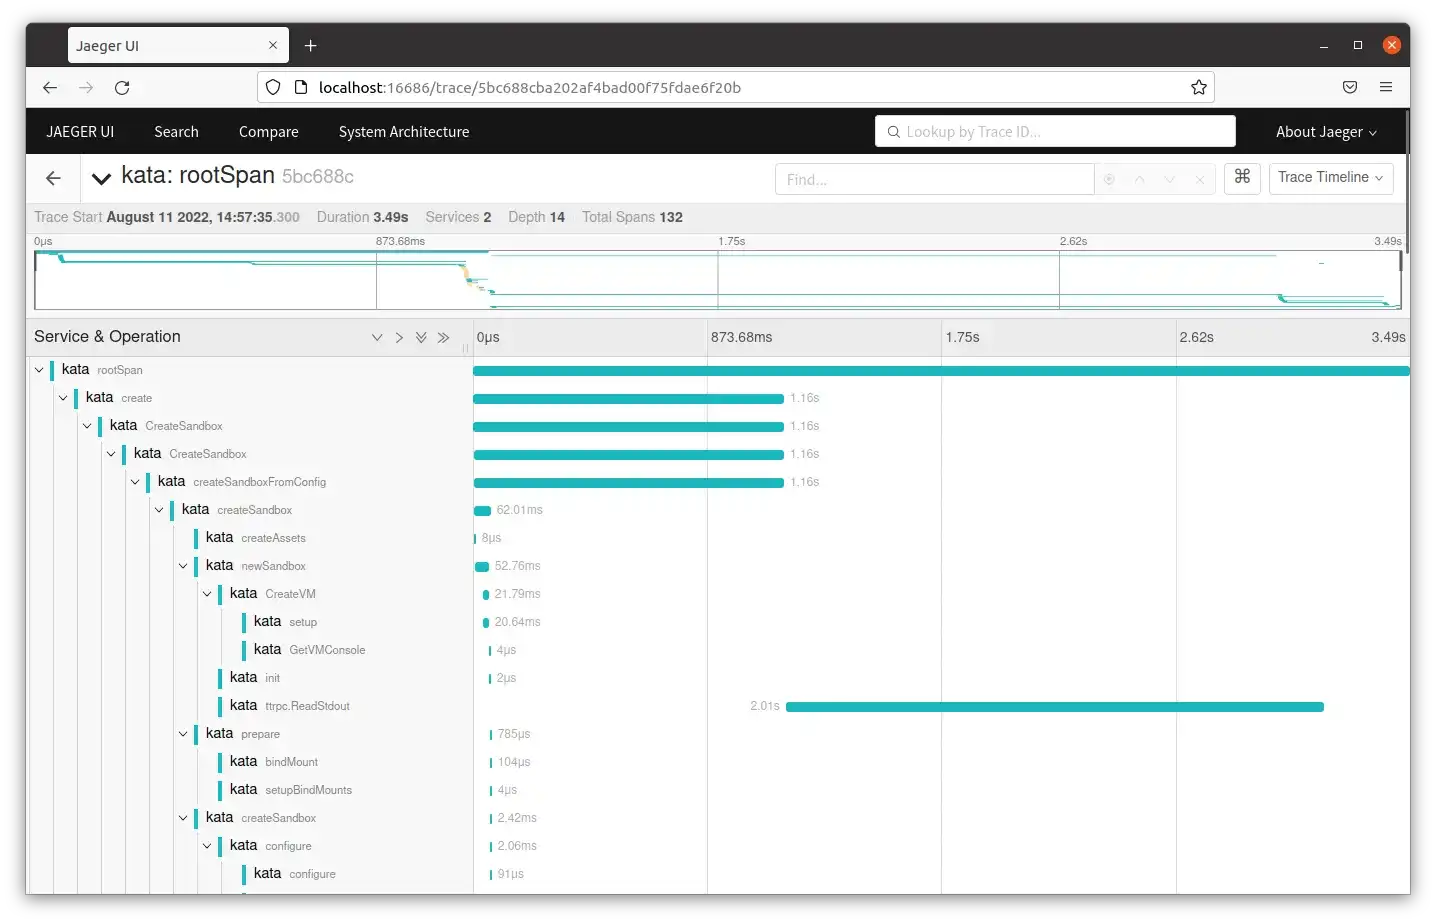
The image below shows a trace opened to view the root span and some of its subsequent spans. The root span duration is the duration of the trace.
Tracing methodology
Kata Containers uses Jaeger, a distributed tracing system, to gather trace spans from the application in order to produce a visualization of transactions from the runtime and agent. There is additionally a trace forwarder component that forwards traces from the agent to Jaeger.
In Kata Containers, spans are created in the runtime and agent using trace calls in specific functions relevant to core functionality of each component. Not every function in this application is traced due to the amount of data produced. An initial root span is created in the runtime from which all other spans will be ultimately be derived; this is the trace. In the runtime, spans are derived from a context which is passed to functions. In this way they form a tree under the root span.
Kata Containers provides two trace options: one for the runtime and one for the agent. By default, both trace options are disabled but if either or both are enabled, the creation of subsequent containers will cause the component in question to produce trace data. If both tracing options are enabled and the trace forwarder is running, all the trace data will be collated together.
The way that Kata Containers deals with tracing is quite elegant:
- If tracing is only enabled for the runtime, the single trace will just contain runtime spans, to represent particular runtime operations.
- Similarly, If tracing is only enabled for the agent, the single trace will just contain agent spans, to show details of particular agent operations.
- However, if both runtime and agent tracing are enabled, again there will only be a single trace, but the trace will contain spans for both the runtime and the agent.
Enabling both runtime and agent tracing allows the user to drill down to see what the agent was doing when a particular runtime operation occurred.
This kind of tracing allows one to get a high level overview of where and when time is spent in the application, as well as details included in the spans as attributes. (In contrast to lower level debugging tools such as strace(1) and perf(1).)
How to get a trace
Kata Containers tracing is enabled through the configuration file. Runtime tracing, agent tracing, or both can be configured:
[runtime]

enable_tracing = true

[agent.kata]

enable_tracing = true
Next, a trace collector, such as Jaeger, is started. An easy way to do this is using Jaeger’s All-in-One executable in a pre-built Docker container as described in the Jaeger Getting Started guide:
$ docker run -d — name jaeger \

-e COLLECTOR\_ZIPKIN\_HOST\_PORT=:9411 \

-e COLLECTOR\_OTLP\_ENABLED=true \

-p 6831:6831/udp \

-p 6832:6832/udp \

-p 5778:5778 \

-p 16686:16686 \

-p 4317:4317 \

-p 4318:4318 \

-p 14250:14250 \

-p 14268:14268 \

-p 14269:14269 \

-p 9411:9411 \

jaegertracing/all-in-one:latest
If tracing the agent, the trace forwarder should be started:
$ kata-trace-forwarder -l trace
For more information about setting up tracing and running the trace forwarder, see the Kata Containers trace forwarder documentation
For more information on configuring and running tracing, see the Kata Containers tracing documentation.
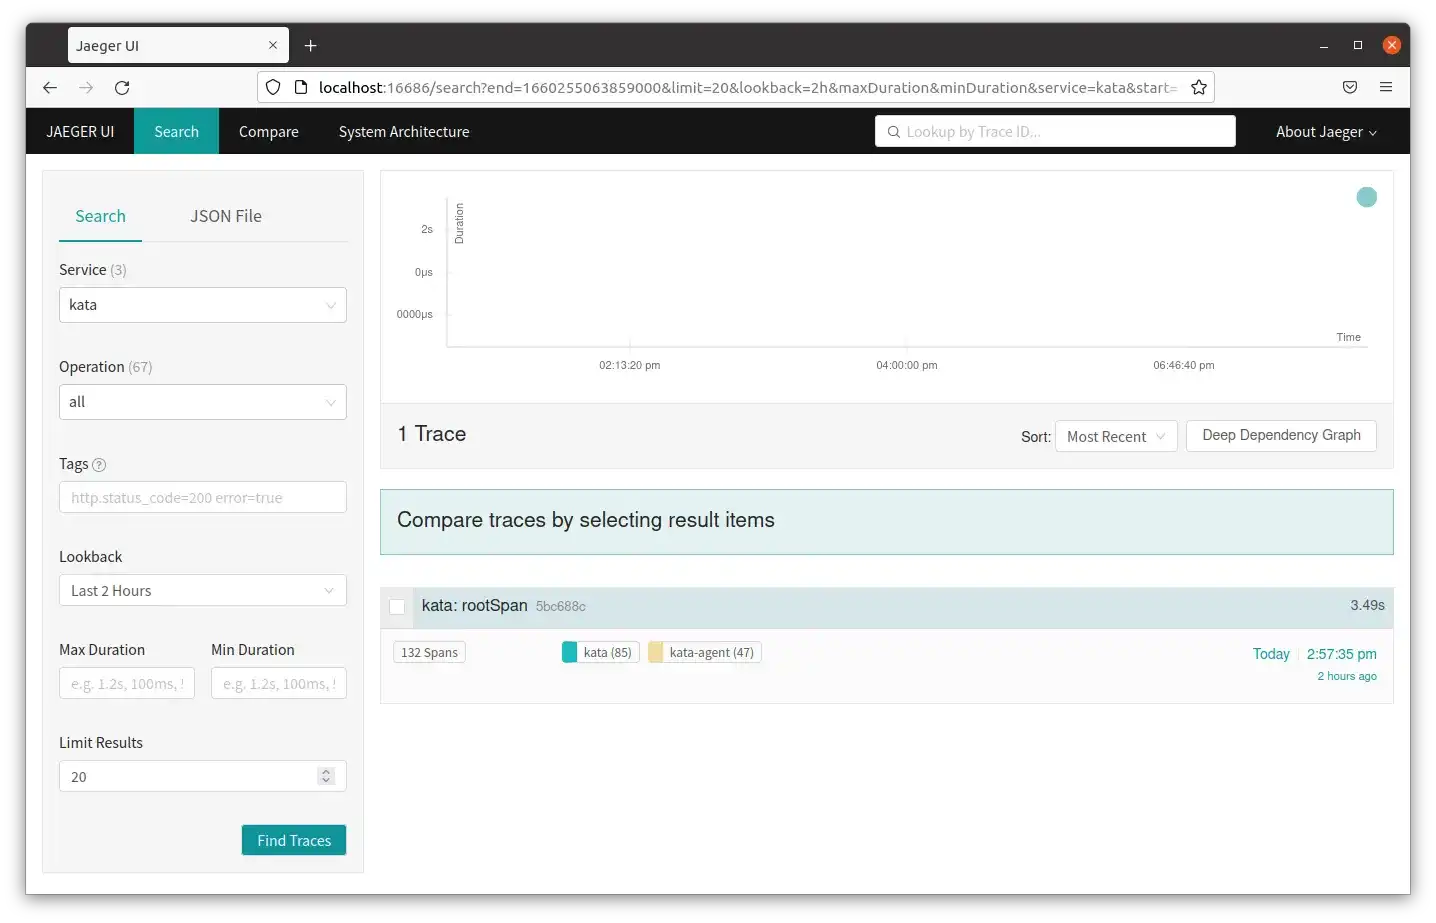
Any container using Kata Containers will now produce trace output that can be viewed in the browser. In the image below the Jaeger UI is opened in the browser with the service kata selected in the menu on the left, which is the runtime. Since the trace contains both kata (runtime) and kata-agent spans, both can be seen in the results under the rootSpan trace. Trace results can also be filtered by specific operation and the number of results can be changed to show more results.
How to analyse a trace
In a previous image the trace data was displayed to show the initial root span in the default view of the trace. The picture below shows a closer view of the startVM span and its child spans with the runtime and agent spans in blue and yellow respectively.
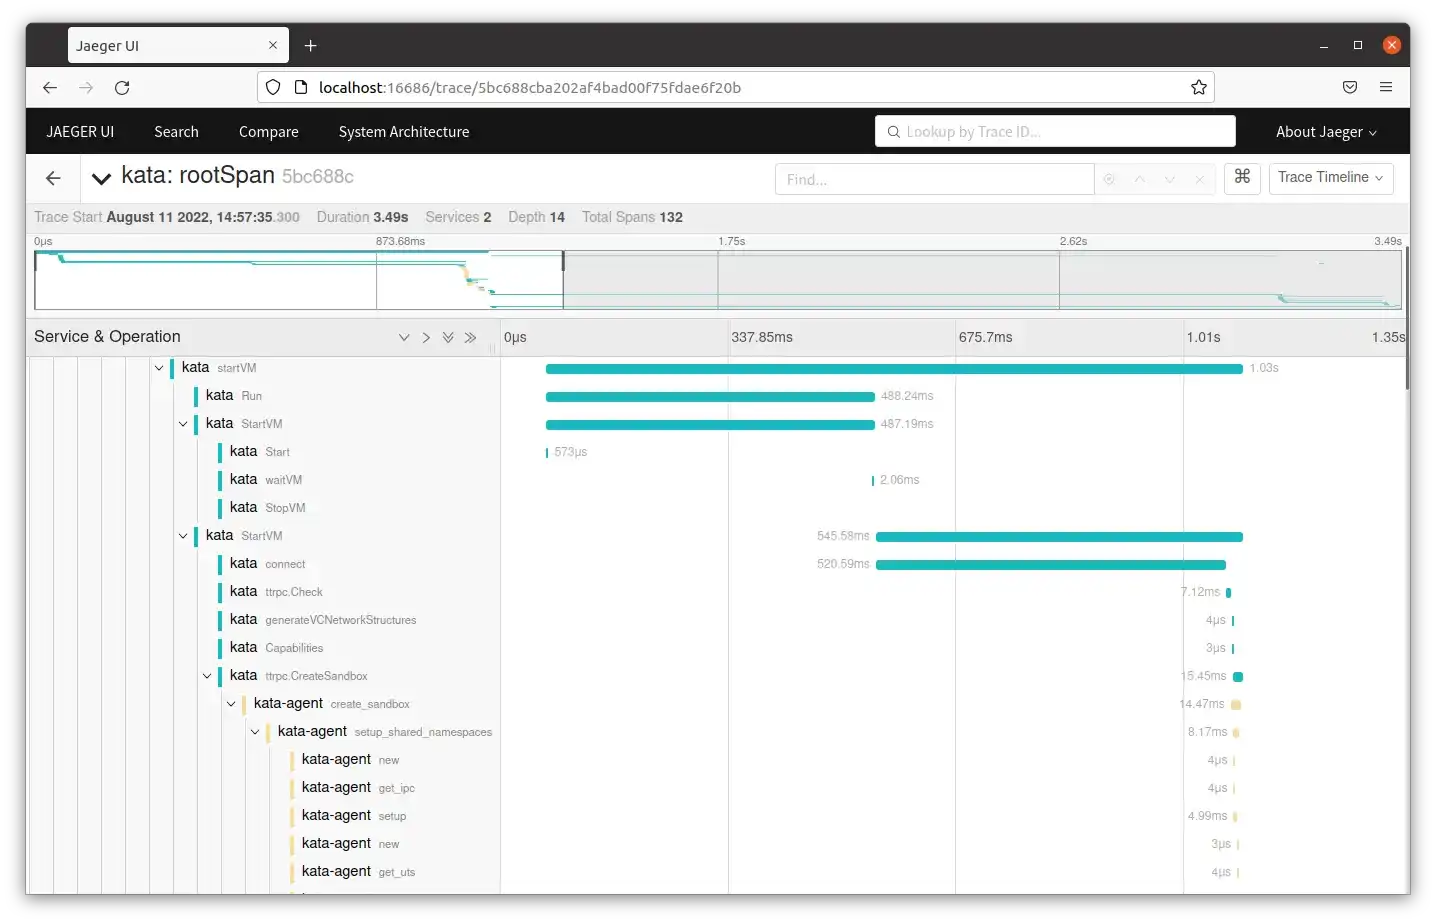
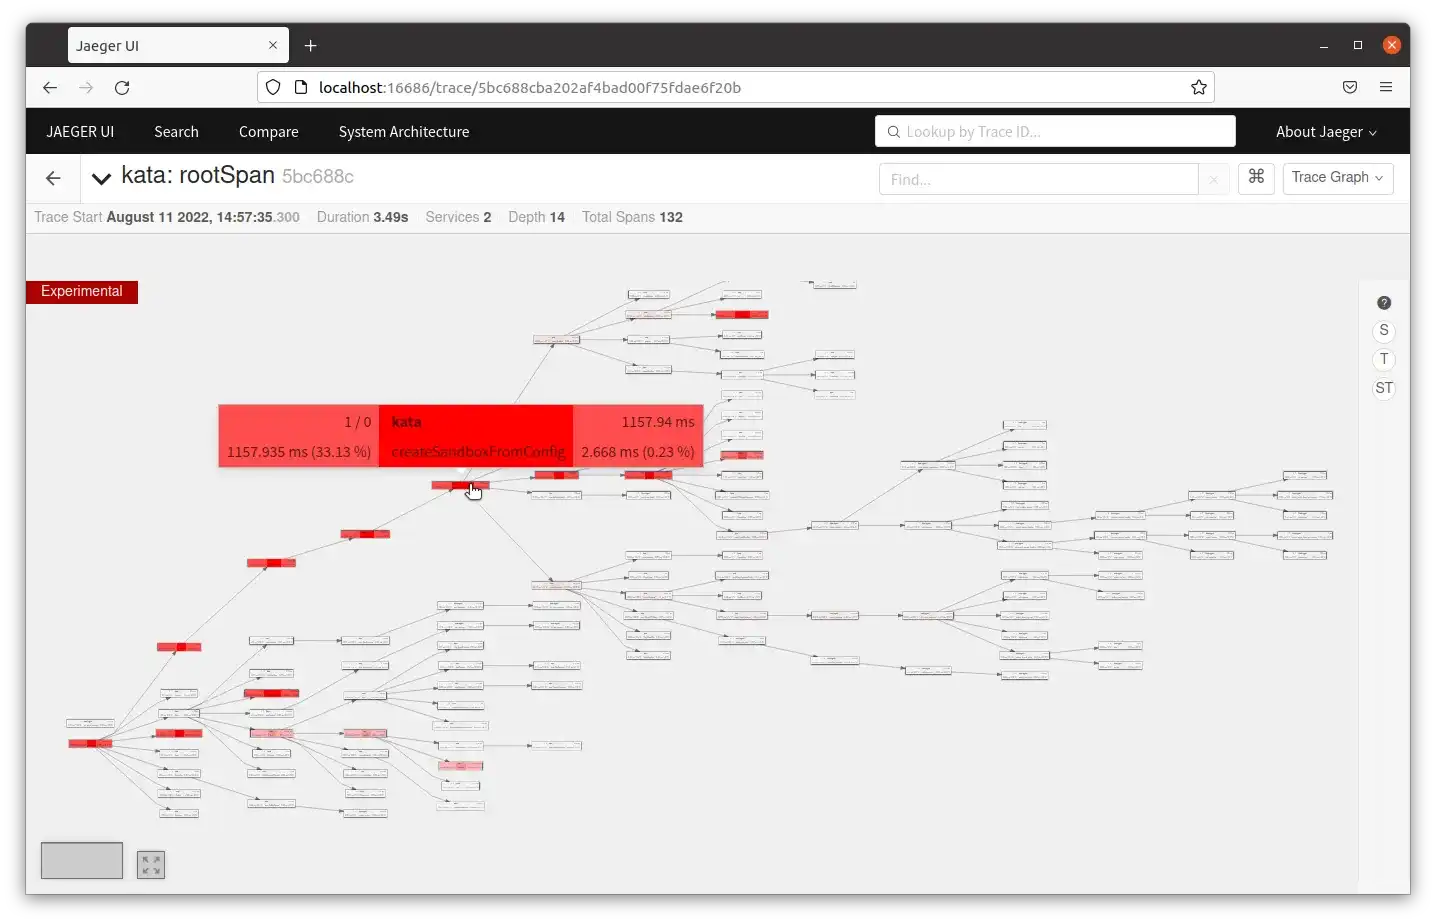
The visualization shows duration for each span and the overlap, if any, of start and end times of children and parent spans. These calls are behaving as expected, but if one takes an unusually long amount of time it will be visible in the output. There are other ways to display data in Jaeger. For example, there is an experimental feature for displaying the trace as a graph with either service or time highlighted, shown below. Jaeger also supports grouping and summarizing output by specific tags.
Tracing versus logging
The Kata Containers runtime uses both logging and tracing, both of which collect details about functions/methods and organize them into reader-friendly output. Logging may contain timestamps and messaging related to errors. This differs from tracing in that it does not contain a duration. Information collected in tracing is in the form of attributes related to the package the function takes place in and information in the logger contains additional information about errors and events. For example, in HotPlugAddDevice, both tracing and logging takes place. Below, we see that the span includes general attributes for the sandbox subsystem as well as sandbox ID. Logging also contains subsystem and sandbox ID with additional information relating to errors returned from AddDevice.
// sandboxTracingTags defines tags for the trace span

var sandboxTracingTags = map[string]string{

  "source": "runtime",

  "package": "virtcontainers",

  "subsystem": "sandbox",

}

// Logger returns a logrus logger appropriate for logging Sandbox messages

func (s *Sandbox) Logger() *logrus.Entry {

  return virtLog.WithFields(logrus.Fields{

    "subsystem": "sandbox",

    "sandbox": s.id,

  })

}

func (s *Sandbox) HotplugAddDevice(ctx context.Context, device api.Device, devType config.DeviceType) error {

  span, ctx := katatrace.Trace(ctx, s.Logger(), "HotplugAddDevice", sandboxTracingTags, map[string]string{"sandbox_id": s.id})

  defer span.End() if s.sandboxController != nil {

      if err := s.sandboxController.AddDevice(device.GetHostPath()); err != nil {

        s.Logger().WithError(err).WithField("device", device).

        Warnf("Coul" not add device to the %s controller", s.sandboxController)

    }

  }

}
While both tracing and logging can and often do report similar information, the above example is typical of Kata Containers usage. Logging is not used for duration, whereas duration in tracing is what allows hierarchical visual output to be created. Tracing may contain some error information, but typically specific errors are reported in log output.
Tracing and logging possibilities
Kata Containers uses structured logging meaning each log record is composed of a set of name=value pairs. Likewise, the Jaeger trace data is composed entirely of name=value pairs. This similarity implies it may make sense to move some of the logging calls into the trace data. There are advantages to doing this: the tracing protocol is extremely lightweight and by adding additional data into the traces makes the trace data richer and may improve overall system performance under certain workload scenarios. Also, since the tracing data format is standardised, it is easy to run queries on any additional data, whereas this is less easy with the log files.
However, not all log data could be moved into the traces since there is an expectation that errors and warnings should be written to a logfile, which unlike the trace data is persisted to storage. Administrators expect to be able to analyse logs so Kata Containers should not surprise them.
Another consideration is that if log data was moved into the traces, tracing would need to be enabled full-time, whereas currently it must be enabled manually. This is to ensure that the data is always available.
A compromise may be to move log data in a set of particular log levels to the trace data (such as debug and info), but retain other levels (such as warning and error).
This topic needs further investigation.
The Future
Kata Containers is constantly evolving and continues to make use of the latest technologies. The upcoming 3.0 release of Kata Containers will include two runtimes: the latest version of the existing golang runtime and a new, optional runtime written in the rust language. The new rust runtime is not only a complete rewrite of the golang runtime, but it provides a brand new in process hypervisor called Dragonball, which is also written in rust.
Part of the Kata Containers 3.x development effort will be to add trace spans to the new rust runtime and hypervisor.
Contributing
Kata Containers is always looking for new contributors. There are many opportunities to get involved from coding in various languages including golang, rust and shell scripting, to writing tests and documentation, triaging issues, and promoting and presenting on this exciting project.
If you would like to get involved with this thriving open source project, see the project contribution guide, or if you just want to chat to use, get in touch with us.
About Kata Containers
Kata Containers is an open infrastructure project of the Open Infrastructure Foundation. Delivering the speed and performance of containers with the security of virtual machines, Kata Containers is designed to be architecture agnostic and is compatible with Open Container Initiative (OCI) images as well as the container runtime interface (CRI) for Kubernetes. Kata Containers is hosted on Github under the Apache 2 license. Connect with the Kata Containers community:
- Freenode IRC: #kata-dev
- Website: katacontainers.io
- Developer Mailing List: lists.katacontainers.io
- Twitter: @KataContainers
- Slack:slack channel